Syneos Health
Syneos Health brought us in to reimagine Reimagine- their internal platform for managing clinical trial operations. The system was fragmented, painfully outdated, and riddled with usability issues that slowed down trial teams and frustrated leadership. It was hard to navigate, harder to trust, and barely supported the fast-moving needs of real-time trial oversight.
Role → UX Designer
Duration → 1 year
Tools → Rough Sketches, Powerpoint, Figma
Internal Team → 1 Project Manager, 1 Business Analytics Lead, 1 Visual Designer, 1 UX Lead
“Translating messy, high-stakes data into a clear, intuitive interface that made insights feel obvious-and finally actionable.”
01
The Challenge

Their legacy system technically worked, but no one wanted to use it. Visuals were confusing. Key data was buried or missing altogether. PMs had to piece together spreadsheets, emails, and offline notes just to track what should’ve been centralized.
This made it impossible to spot struggling trials until it was too late- and leadership was flying blind.
Our challenge: design a clean, role-specific interface that simplified trial oversight, reduced onboarding time, and helped teams triage problems before they spiraled. The new experience needed to serve everyone- from daily users to high-level execs- with fewer clicks, clearer paths, and way more trust in the data.
'PM's are spending 50% of their time tracking stuff that our system is supposed to tell them'
02
Discovery + Research

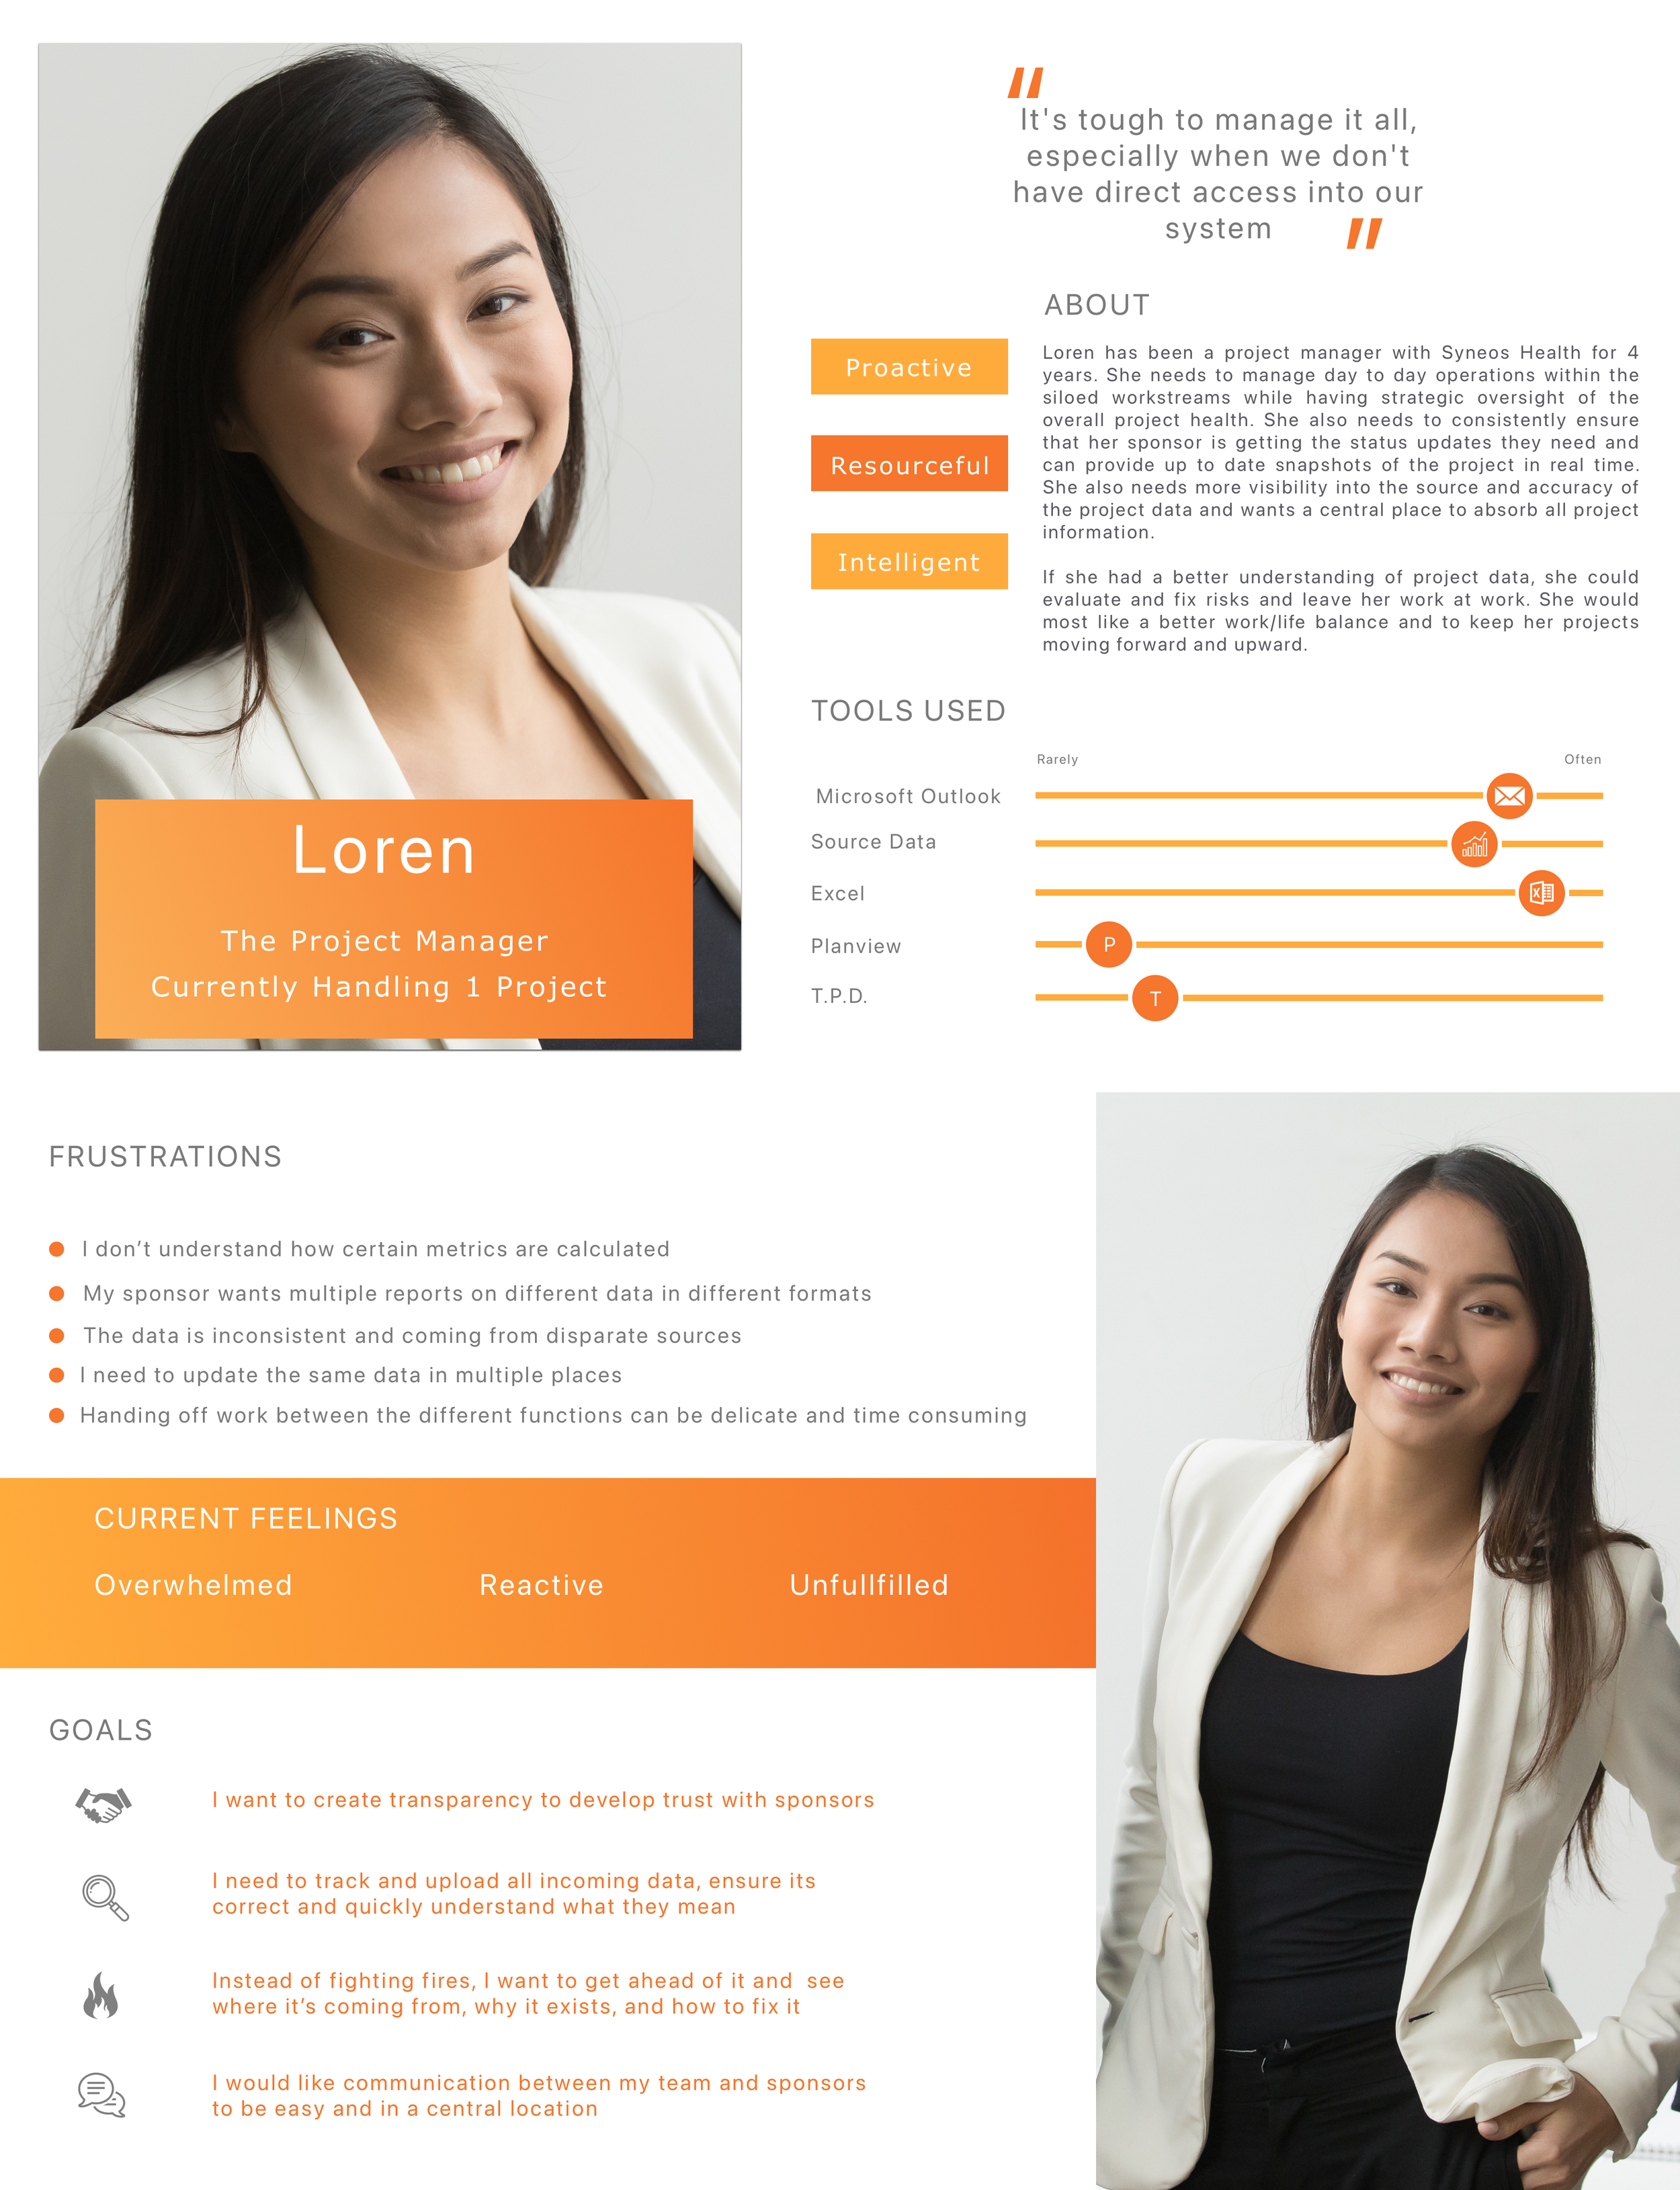
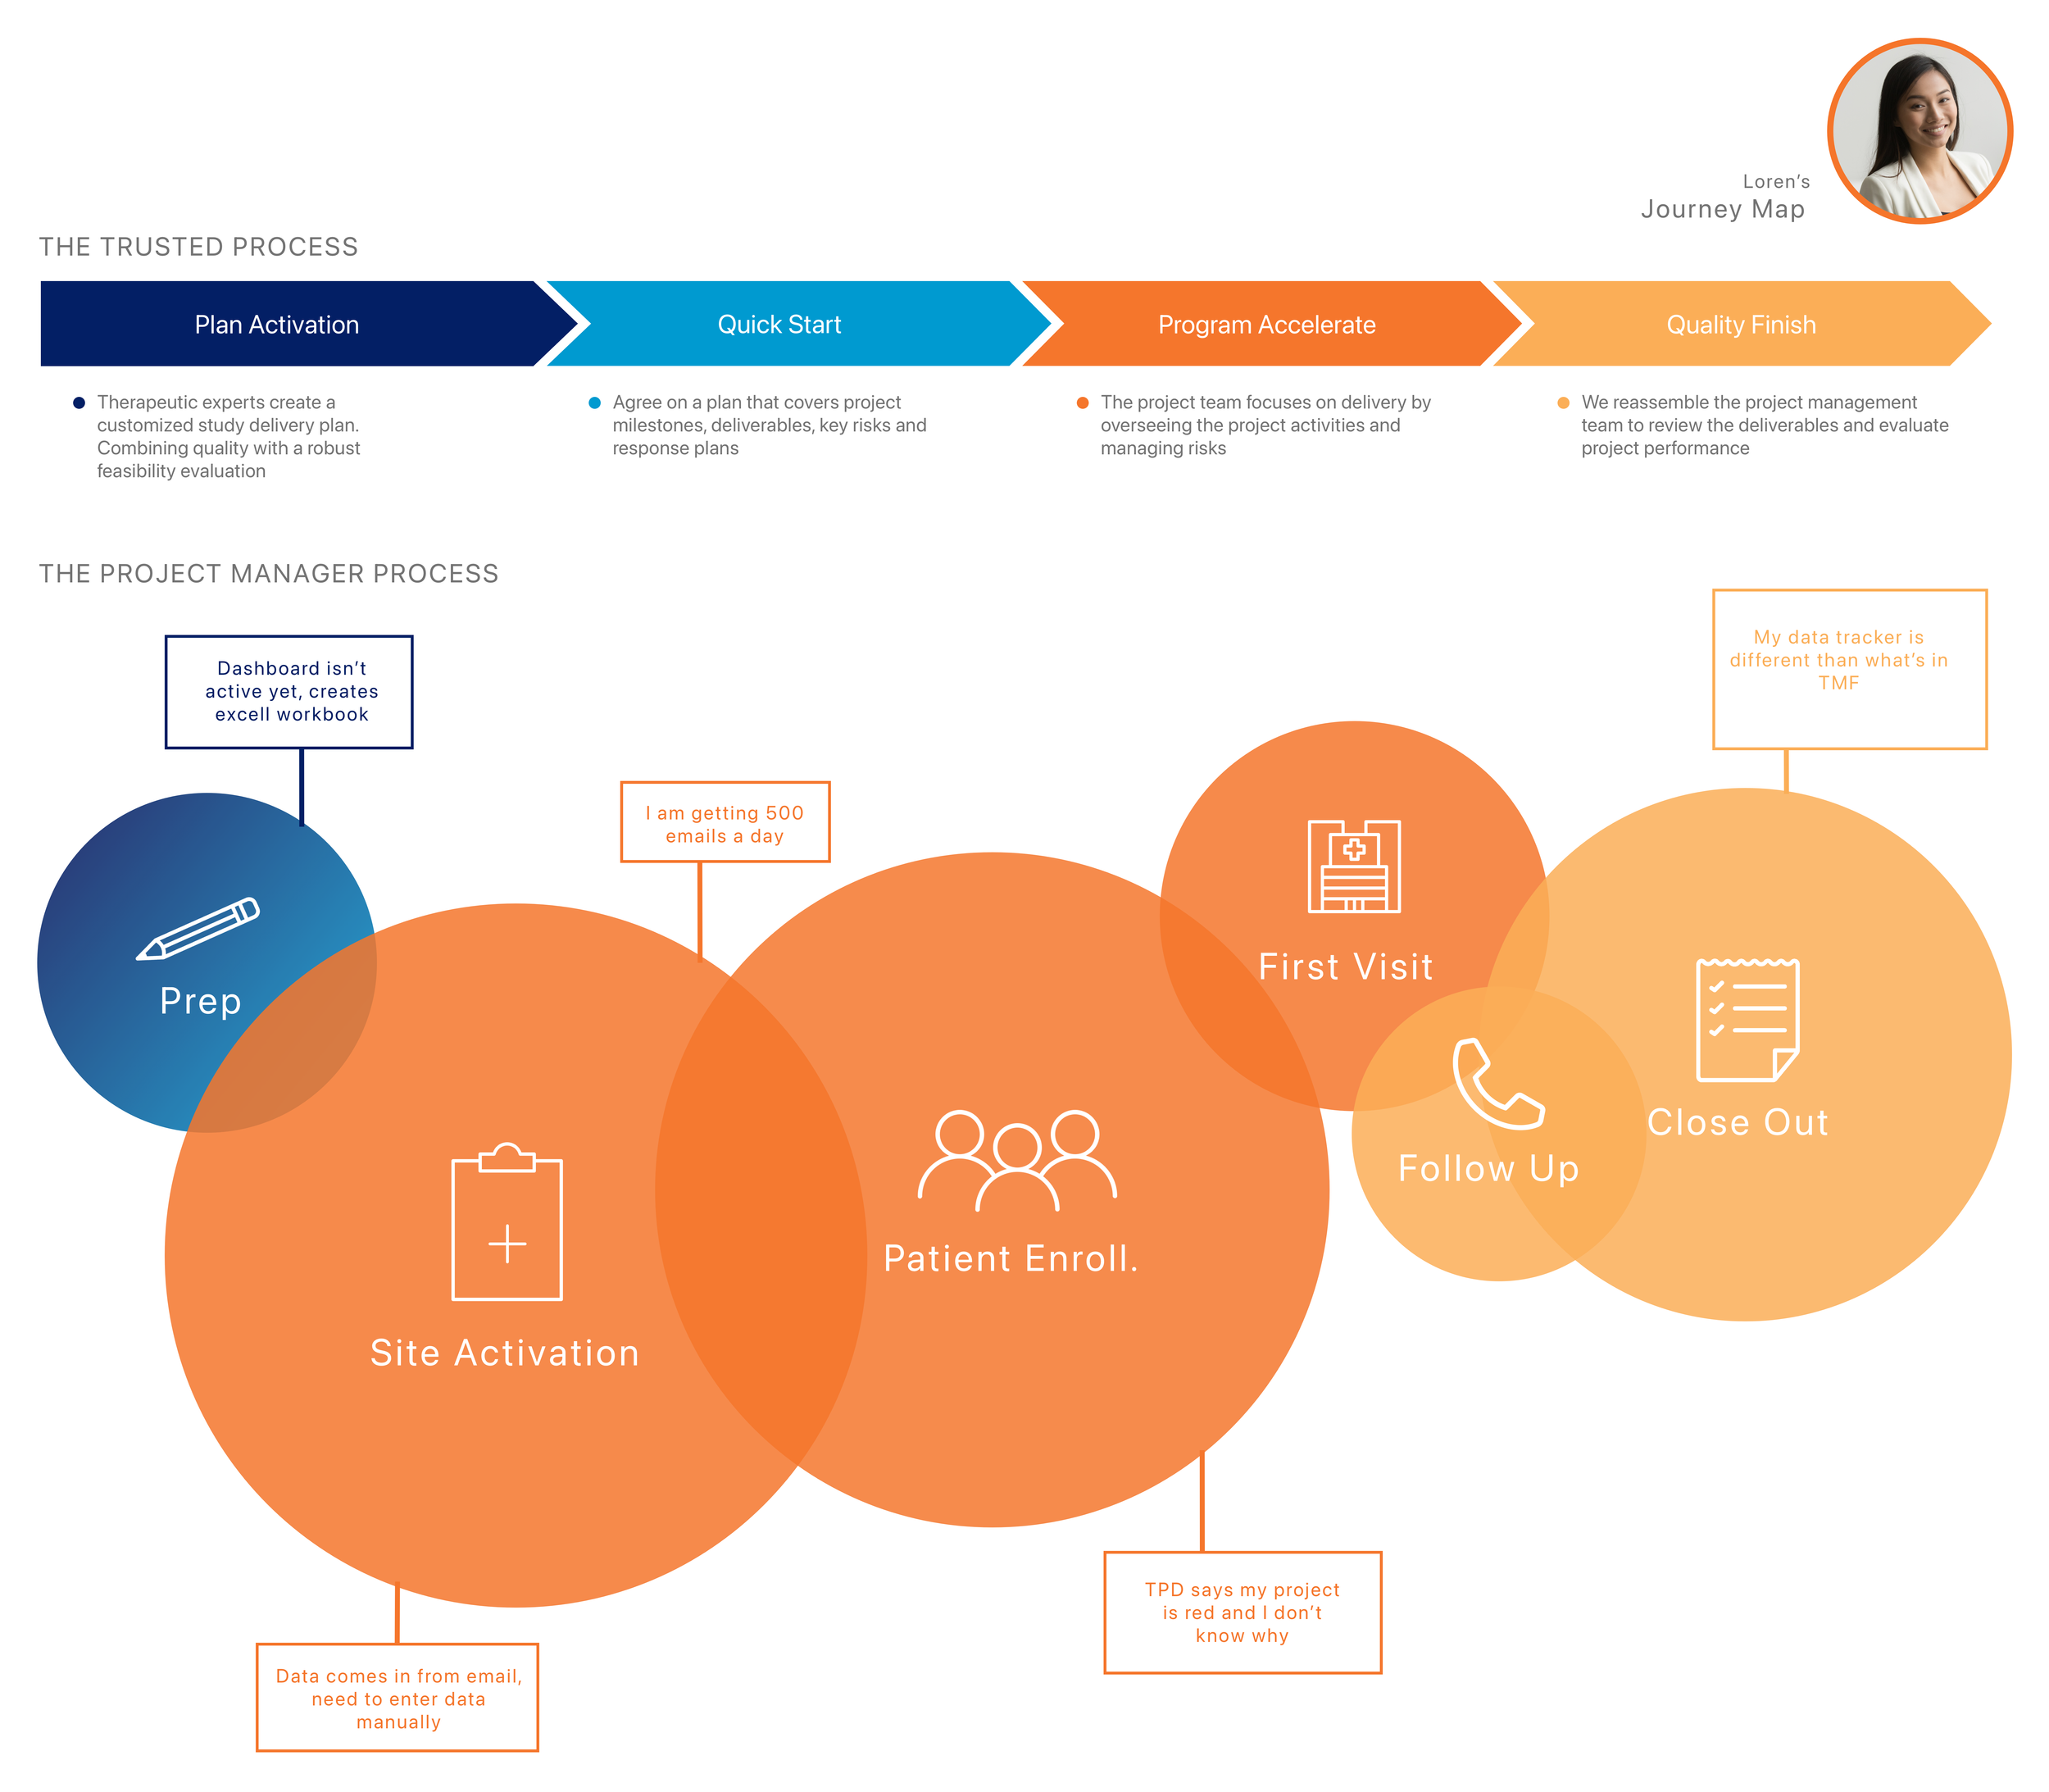
We were lucky. This client gave us time. Real time. Instead of rushing a band-aid fix, they invited us to dig deep, and we did. Over the span of several weeks, we ran extensive interviews with 25+ users across clinical ops and recruitment teams, mapping out workflows, surfacing pain points, and gathering the kind of raw, unfiltered feedback most teams never get.
What we found? A tangled mess. People were managing critical trial operations through clunky spreadsheets, disconnected dashboards, and systems they barely trusted. Information was buried in siloed tools, task statuses were a guessing game, and project managers had no real way to flag when trials were slipping into crisis mode. Most of the oversight happened offline, because the platform itself wasn’t doing the job.
To make our case, we didn’t just talk- we showed. We crafted vivid, visual storytelling artifacts that distilled all that user data into compelling, undeniable insights. These weren’t your typical research decks; they were immersive, persuasive, and built to get buy-in at the highest level. And it worked. With stakeholders aligned, we had a clear path forward.

03
Ideation + Envisioning
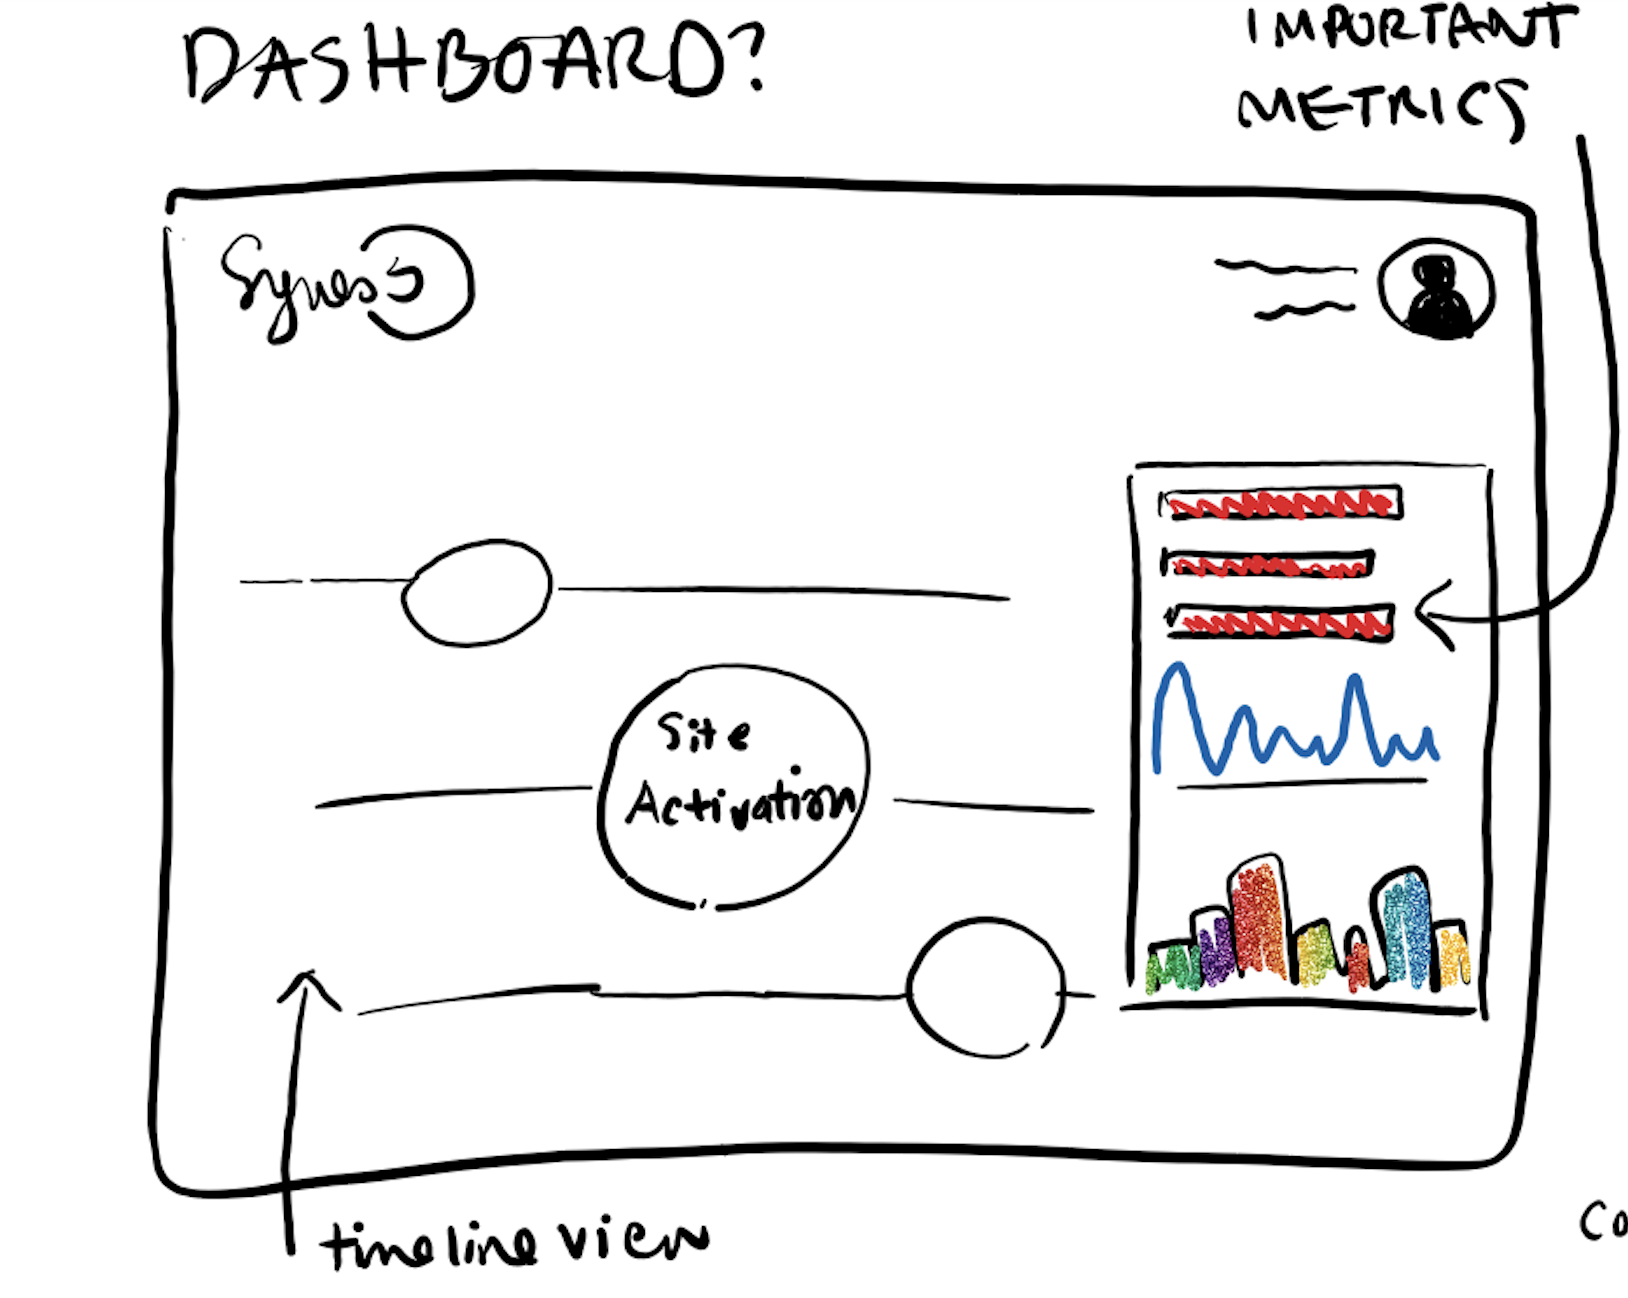
Moving into wireframing on this project was anything but straightforward. With a data-heavy product like this, early-stage whiteboarding felt deceptively simple- at that level, it was easy to sketch out broad page intentions. But once we started turning those ideas into mid- and high-fidelity wireframes, the real complexity showed up fast.
Every team had their own set of metrics they considered “must-have,” and no one was willing to compromise. Everyone wanted 100+ data points displayed at a glance, which made it incredibly difficult to create visual hierarchy or flow. The client was clear: no placeholder data, no mock values- they wanted real math, real numbers, real scenarios. That slowed things down significantly.
We had to push back. Our role at that stage was to define layout, interaction flow, and hierarchy- not to build pixel-perfect dashboards packed with final analytics. It took multiple rounds of iteration to help the client see that. Still, we moved forward strategically, continuously refining structure while keeping the eventual data load in mind. Designing for clarity without sacrificing what mattered most to each department became our north star.
Ultimately, we created wireframes that balanced precision with usability- meeting the data needs of clinical ops and recruitment teams without turning the interface into a labyrinth.

04
UX Design & Strategy

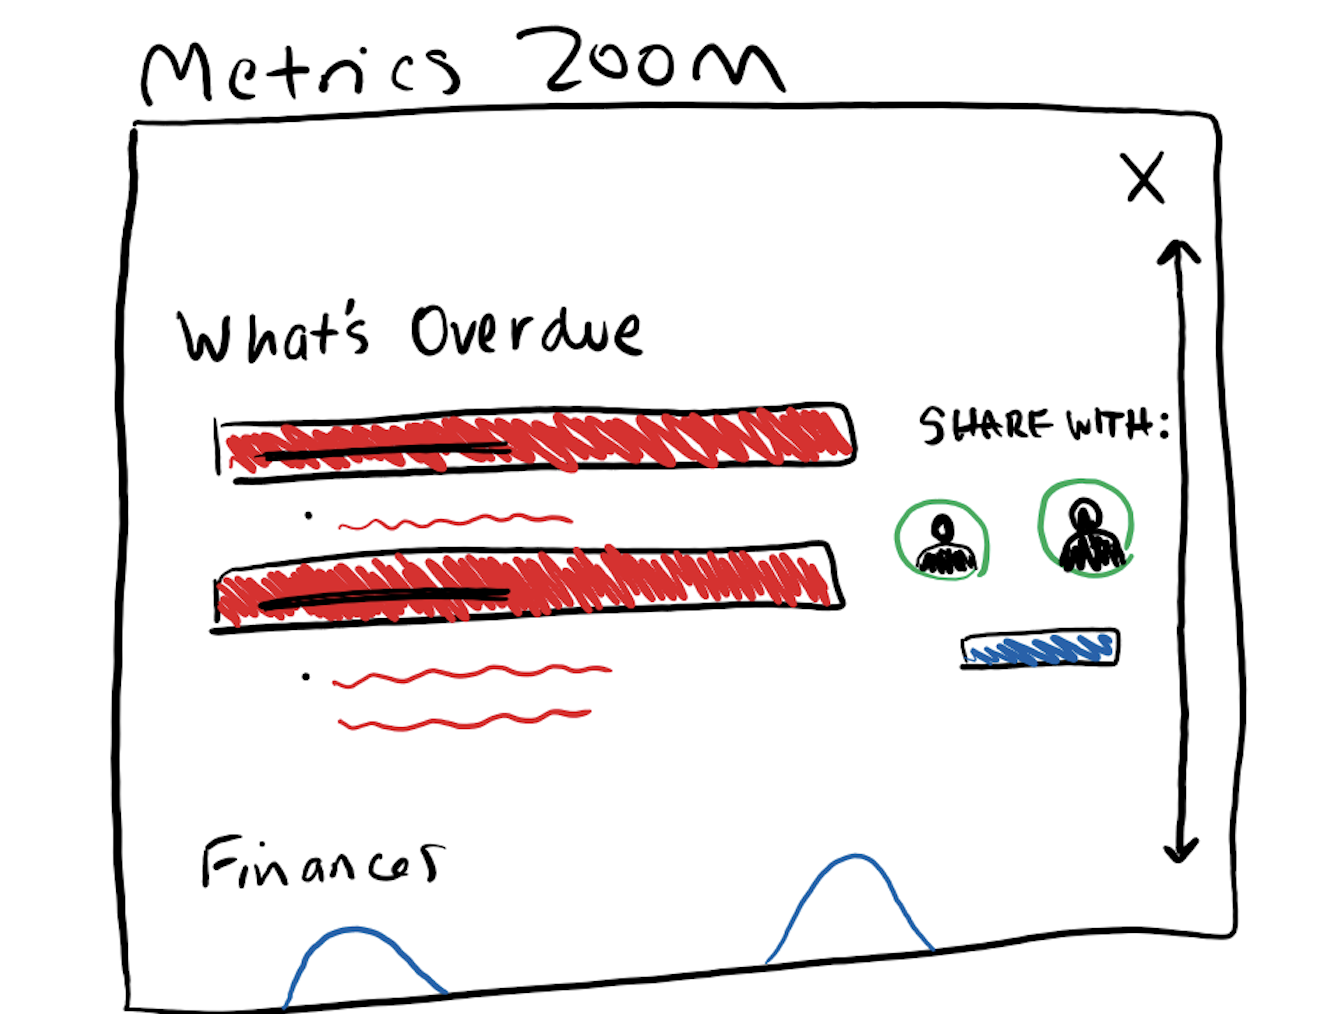
We tackled this project with two consecutive work streams, designing distinct dashboards with drill-down functionality tailored to two clinical teams with wildly different needs. Once we landed on the core structure- key sections, flow, and metrics- we quickly realized this wasn’t going to be a typical UX process. These were data-heavy screens, and the stakeholders wanted everything. Every metric. Every filter. Every breakdown. Every state.
To keep it usable, we leaned hard into visual hierarchy, collapsible filter panels, and clear role-based access. Every page opened with a high-level summary, timeline or topline metrics- followed by detailed visualizations that updated on click. So if you tapped into trial enrollment numbers, you’d instantly see the breakdown by location, demographic, and beyond. We used hovers liberally to add interpretive context without overwhelming the interface. Not ideal, but necessary when you’re designing for teams where new hires need to get up to speed on dense clinical data from day one.
Stakeholder reviews were brutal- not because the designs missed the mark, but because our mock data wasn’t realistic enough. We had to build dozens of hyper-accurate wireframes just to get past feedback like, “That percentage doesn’t make sense for this Y-axis,” which- bless them- wasn’t even the point. But we adapted. We grounded every decision in consistency and predictability, establishing patterns and scalable components that could stretch across future modules without bloating development scope.
No drag-and-drop shortcuts here. We said no to the out-of-box toolkit the devs proposed because we knew it would replicate the same unusable designs they were trying to fix. Instead, we gave them a design system that respected the complexity of the data and the humans trying to make sense of it.

05
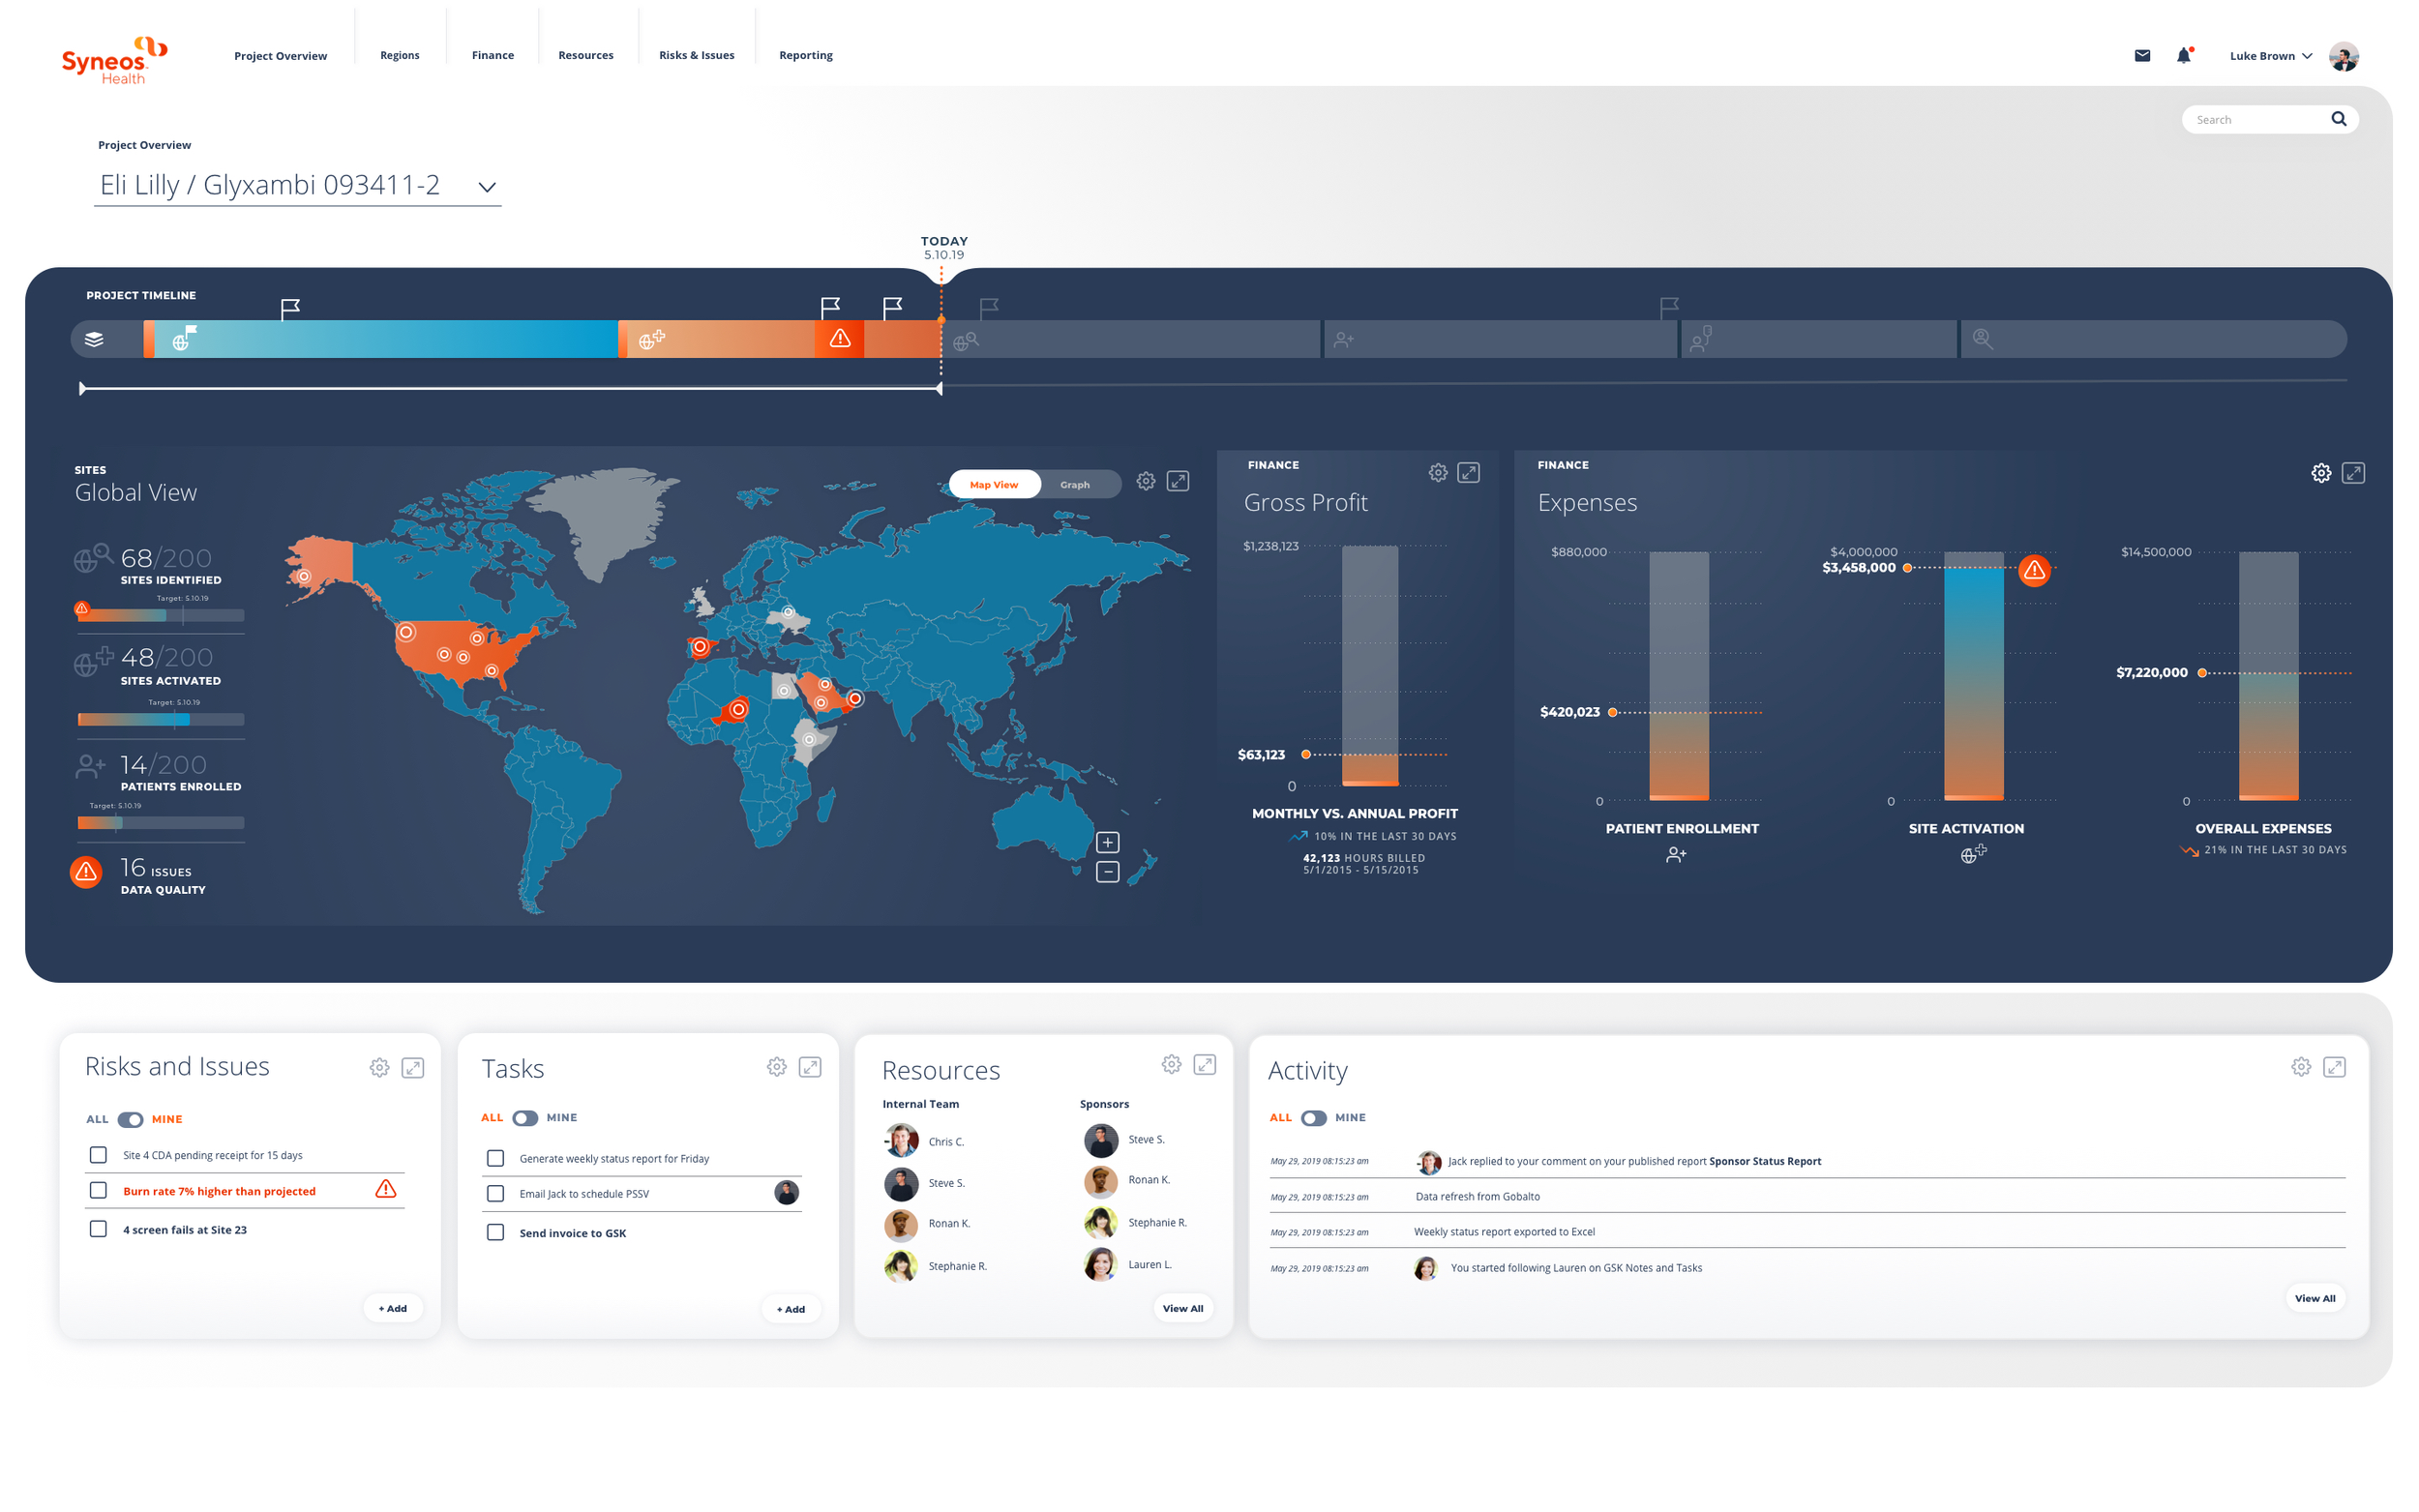
Solution
We delivered a sleek, intuitive dashboard system that paired meaningful data with a clean interface. The final designs balanced visual elegance with functional clarity, layering logic-first flows beneath dynamic color and layout choices. Every user need was met head-on: onboarding modules, contextual help, and real-time task feedback were baked into the core experience. Despite differing opinions on the final visual execution, we ensured the result was a powerful partnership of aesthetics and utility-and gave the client exactly what they asked for (and then some).
Reflection & Outcomes
This one taught me how to design for complexity, not against it. I led with clarity and translated messy, multi-layered data into interaction patterns that felt natural and intuitive. It wasn’t just about cleaning things up- it was about giving people visibility into their work for the first time. And given the industry, this had the potential for a huge impact.
What worked
Synthesizing messy data into a logical hierarchy that made sense to real humans. My research, ideation, and deep understanding of both the business logic and the people behind it became foundational to delivering good work.
What didn’t
The visual design phase pulled toward style over substance. I fought to keep accessibility and hierarchy at the center, even when the visuals drifted a bit.
Biggest win
Seeing the client’s reaction as we made big breakthroughs together. They were finally able to see how their data could be laid out clearly, with their needs actually reflected. Even knowing the final build might never look quite this polished, they saw what was possible.